Lake Forest
Single Family Residence
January 1, 2017-January 31, 2018

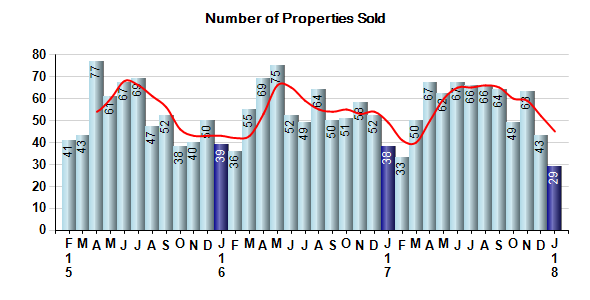
Property Sales:
January property sales were 29, down from 38 in January of 2017 and -32.6% lower than the 43 sales last month. January 2018 sales were at their lowest level compared to January of 2017 and 2016. January YTD sales of 29 are running -23.7% behind last year’s year-to-date sales of 38.
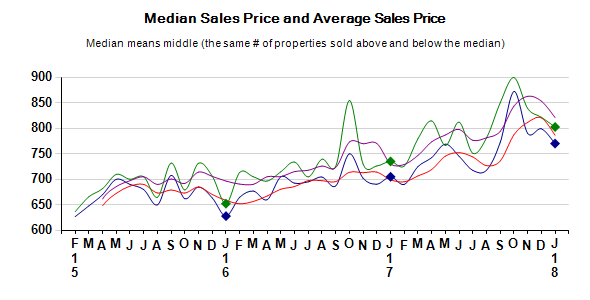
Prices:
The median sales price in January was $770,000, up 9.2% from $705,000 in January of 2017 and down -3.6% from $799,000 last month. The average sales price in January was $802,506, up 9.2% from $735,034 in January of 2017 and down -2.3% from $821,570 last month. January 2018 ASP was at highest level compared to January of 2017 and 2016.
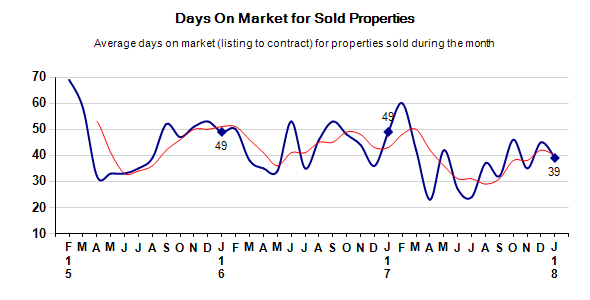
Market Time:
The average Days On Market (DOM) shows how many days the average property is on the market before it sells. An upward trend in DOM tends to indicate a move towards more of a buyer’s market, a downward trend a move towards more of a seller’s market. The DOM for January was 39, down from 45 days last month and down from 49 days in January of last year. The January 2018 DOM was at its lowest level compared with January of 2017 and 2016.
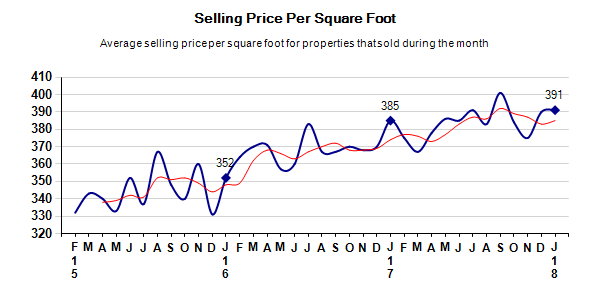
Selling Price Per Square Foot:
The selling price per square foot is a great indicator for the direction of property values. Since median sales price and average sales price can be impacted by the ‘mix’ of high or low end properties in the market, the selling price per square foot is a more normalized indicator on the direction of property values. The January 2018 selling price per square foot of $391 was up 0.3% from $390 last month and up 1.6% from $385 in January of last year.
Selling Price vs Listing Price:
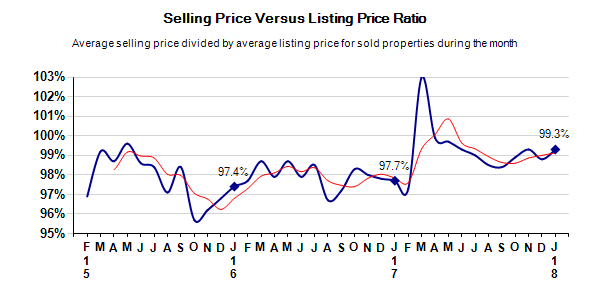
The selling price vs listing price reveals the average amount that sellers are agreeing to come down from their list price. The lower the ratio is below 100% the more of a buyer’s market exists, a ratio at or above 100% indicates more of a seller’s market. The January 2018 selling price vs list price of 99.3% was up from 98.8% last month and up from 97.7% in January of last year.
Inventory / New Listings / Sales:
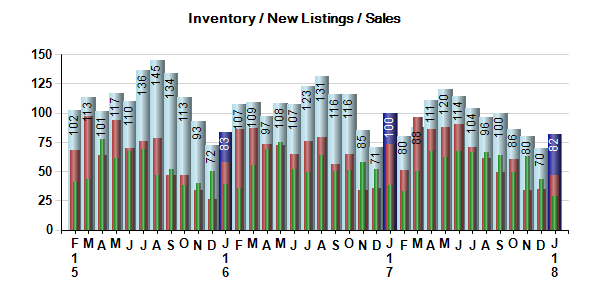
This last view of the market combines monthly inventory of properties for sale along with new listings and sales. The graph shows the basic annual seasonality of the market as well as the relationship between these items. The number of new listings in January 2018 was 47, up 34.3% from 35 last month and down -35.6% from 73 in January of last year.
Not intended as a solicitation if your property is already listed by another broker. Real estate agents affiliated with Coldwell Banker Residential Brokerage are independent contractor agents and are not employees of the Company. ©2018 Coldwell Banker Residential Brokerage. All Rights Reserved. Coldwell Banker Residential Brokerage fully supports the principles of the Fair Housing Act and the Equal Opportunity Act. Owned by a subsidiary of NRT LLC. Coldwell Banker, the Coldwell Banker Logo, Coldwell Banker Global Luxury and the Coldwell Banker Global Luxury logo service marks are registered or pending registrations owned by Coldwell Banker Real Estate LLC.
Based on information from Source (MarketQuest) for the Regional Parameters (Lake Forest) in all price ranges as reported on Date Report Was Pulled for the period of Date Range (1/1/17-1/31/18), calculated by multiplying the number of buyer and/or seller sides by sales price. One unit equals one side of a transaction (buyer or seller). Source data is deemed reliable but not guaranteed. The Broker/Agent providing the information contained herein may or may not have been the Listing and/or Selling Agent.


