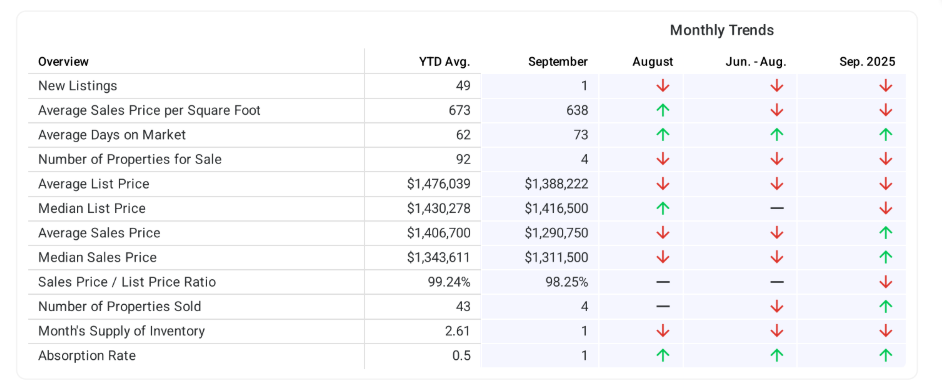
The overview below shows real estate activity from January 2026 to September 2026. You will see data comparisons between September and the previous month, the last three months and September 2025.
Average & Median Sales Price
The median sales price in September 2026 was $1,311,500, down -16.46% from $1,570,000 from the previous month and 9.29% higher than $1,200,000 from September 2025. The September 2026 median sales price was at a mid level compared to September 2025 and 2024. The average sales price in September 2026 was $1,290,750, down -18.90% from $1,591,462 from the previous month and 9.48% higher than $1,179,000 from September 2025. The September 2026 average sale price was at a mid level compared to September 2025 and 2024.
Sales Price / List Price Ratio
The sales price/list price ratio is the average sale price divided by the average list price for sold properties expressed as a percentage. If it is above 100%, homes are selling for more than the list price. If it is less than 100%, homes are selling for less than the list price.The September 2026 sales price/list price ratio was 98.25%, equal to the previous month and down from 101.31% from September 2025.
Number of Properties Sold & Absorption Rate
The number of properties sold in September 2026 was 4, equal to the previous month and 33.33% higher than 3 from September 2025. The September 2026 sales were at a mid level compared to September 2025 and 2024. Absorption rate is the avg number of sales per month divided by the total number of available properties.
Average Days on Market
The average days on market (DOM) is the number of days a property is on the market before it sells. An upward trend in DOM tends to indicate a move towards a buyer's market, a downward trend tends to indicate a move towards seller's market. The DOM for September 2026 was 73 days, up 73.81% from 42 days from the previous month and 160.71% higher than 28 days from September 2025. The September 2026 DOM was at its highest level compared with September 2025 and 2024.
Average Sales Price per Square Foot
The average sales price per square foot is a more normalized indicator for the direction of property value. The sales price per square foot in September 2026 was $638, up 2.74% from $621 from the previous month and -7.00% lower than $686 from September 2025.
Inventory & MSI
The number of properties for sale in September 2026 was 4, down -63.64% from 11 from the previous month and -77.78% lower than 18 from September 2025. The September 2026 inventory was at its lowest level compared with September 2025 and 2024. A comparatively lower MSI is more beneficial for sellers while a higher MSI is better for buyers. The September 2026 MSI of 1 months was at its lowest level compared with September 2025 and 2024.
New Listings
The number of new listings in September 2026 was 1, down -75.00% from 4 from the previous month and -87.50% lower than 8 from September 2025. The September 2026 listings were at its lowest level compared to September 2025 and 2024.
Check out this article next