Happy New Year to you!
Please find 2022 Loan Limit Chart for your toolbox. It covers maximum loan limits “all counties” for both Conventional & Government mortgages.
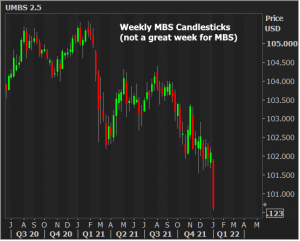
Mortgage Rates are on the rise in a significant way. In fact, Mortgage Bonds and Treasury Bonds have given up the last their last 2 years of gains in the past 11 trading day! Let that sink in for a minute. The weeks Fed Meeting Minutes showed not only a fast exit from purchasing bonds (tapering), but announce intention to sell the balance sheet. This means all the mortgages the government purchased over the last 2 years will be sold, and this will bring “significant” supply to the market, so we are anticipating more selling and higher rates moving forward.
Today, Nonfarm payrolls came in at 199k versus a median forecast of 400k. On almost any NFP Friday before the pandemic, this would be worth some positivity in the bond market. While that may have been the initial reaction in the first minute following the data, bonds quickly reversed course and moved into weaker territory again due to the Fed announcement mentioned above.
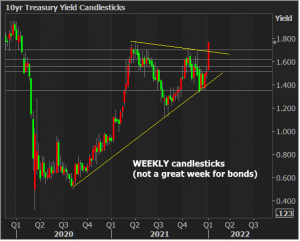
Looking at weekly candlesticks in MBS and Treasuries reinforces the severity of the current sell-off.


Notice in the previous chart that 10yr yields are in the process of challenging the 1.77% technical ceiling. They’ve made it as high a 1.783 as of this writing, but that has not yet resulted in any massive follow-through. Attempted breakouts such as this can occasionally prompt value buying as opposed to more selling, but we probably won’t get a clean read on that until next week.
The Bottom Line: if you read my weekly rate watch updates the shift in rates should be no surprise to you. Be aware is that a very big, very important, and relatively abrupt “repricing” of expectations is taking place. It has to do both with omicron’s impact and the Fed’s policy outlook. Batten down the hatches, etc. Things could get worse before they get better! I am locking ALL loans as soon as escrow opens.


